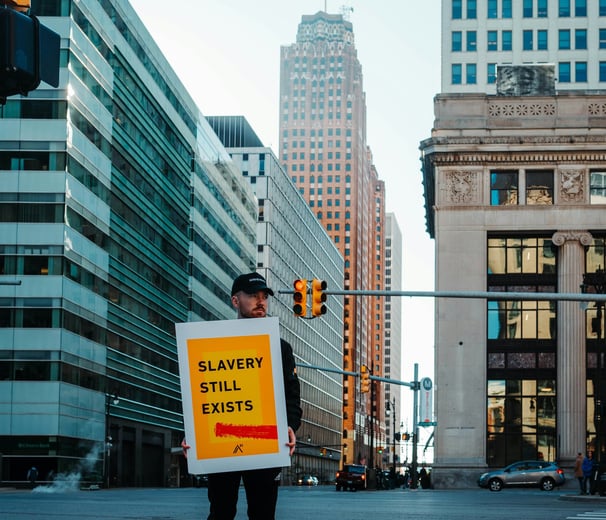
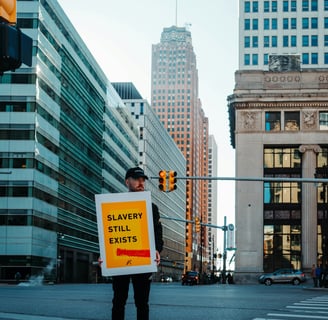
Unveiling the Hidden Chains: A Data-Driven Perspective on Modern Slavery
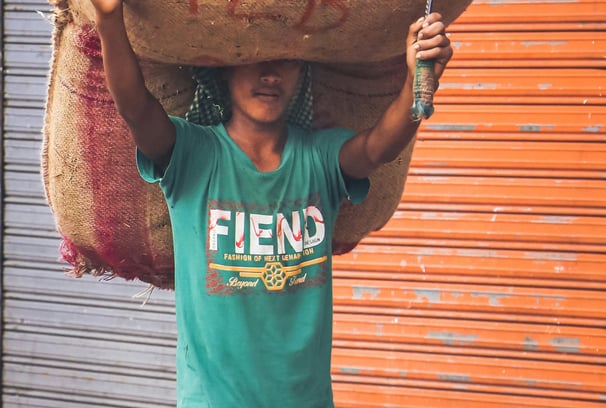
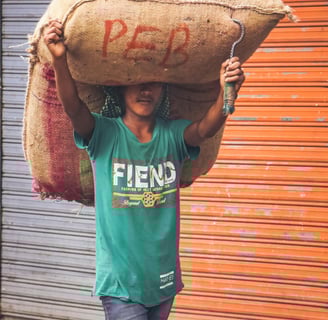
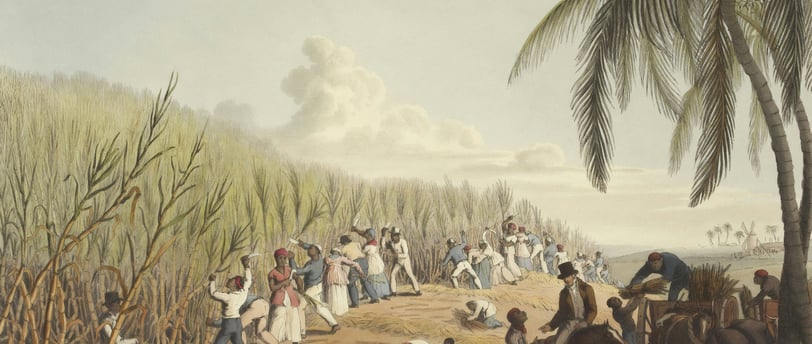
Modern slavery is one of the gravest injustices of our time, affecting an estimated 50 million people worldwide as of 2021. While the term might evoke images of past atrocities, the reality of modern slavery is a pressing and often invisible issue in today’s global society. The Global Slavery Index (GSI), published by Walk Free, sheds light on this complex and multifaceted problem. By leveraging data, the GSI not only quantifies the prevalence of modern slavery but also reveals its underlying causes and the varying effectiveness of global efforts to combat it.
Understanding the Scope
The GSI paints a stark picture of modern slavery’s global footprint. Approximately one in every 150 individuals is trapped in forced labor, forced marriage, or other forms of exploitation. The data exposes regional disparities, with countries like North Korea, Eritrea, and Afghanistan showing alarmingly high rates of slavery due to factors like political oppression and conflict. In contrast, nations with stronger governance and human rights protections tend to have lower prevalence rates, yet no country is immune. Even high-income countries harbor hidden victims, often in industries like agriculture, domestic work, and construction.
The Drivers of Vulnerability
What makes certain populations more susceptible to modern slavery? The GSI identifies key drivers, including poverty, political instability, gender inequality, and weak governance. Vulnerable groups often lack access to basic needs like education, healthcare, and employment opportunities, making them easy targets for exploitation. Additionally, global supply chains play a significant role. Everyday products, from the clothes we wear to the gadgets we use, may be tainted by forced labor at some point in their production.
Governments’ Role in Combating Slavery
The GSI also evaluates how governments respond to the issue, highlighting best practices and areas for improvement. Some nations, such as the Netherlands and the United Kingdom, have implemented robust anti-slavery measures, including comprehensive legislation, survivor support systems, and rigorous enforcement of labor laws. However, many countries lag behind, either due to lack of resources, political will, or systemic corruption. This variability underscores the importance of holding governments accountable and fostering international cooperation to eradicate modern slavery.
A Fresh Perspective Through Data Visualization
While the GSI’s findings are compelling, presenting them through engaging and insightful visualizations can further amplify their impact. Here are four suggested visualizations to complement this narrative:
Global Prevalence Heatmap: A world map displaying the prevalence of modern slavery per 1,000 population. Using a color gradient, this map can immediately convey the regions where the issue is most severe, offering a geographical context for advocacy efforts.
Vulnerability Factors Correlation Matrix: A matrix chart showing the relationship between vulnerability factors (e.g., poverty, gender inequality, conflict) and slavery prevalence. This visualization can help stakeholders prioritize interventions by identifying the most influential drivers.
Government Response Effectiveness Bar Chart: A bar chart ranking countries based on their anti-slavery efforts. Highlighting both leaders and laggards can motivate change and serve as a benchmark for policymakers.
Time-Series Analysis of Modern Slavery Trends: A line graph tracking changes in modern slavery prevalence over time. Breaking this data down by region and type of exploitation can reveal trends and the long-term impact of interventions.
Why This Matters
Modern slavery is not just a human rights issue—it’s a moral, economic, and social challenge that demands collective action. The GSI’s data provides a critical foundation for understanding the problem, but data alone is not enough. By translating these insights into actionable strategies and fostering global accountability, we can dismantle the systems that perpetuate exploitation.
Through tools like Tableau, these suggested visualizations can bring the hidden realities of modern slavery to light, inspiring both awareness and action. By understanding the story behind the numbers, we can pave the way for a future where freedom is not a privilege, but a universal right.